感谢,这么针对性的反馈是很有意义的,我们看到了。
暂时我也回答不了这个问题,下周上班我会当面和大佬 @minggo 提这个帖子,提醒他来看。现在正是假期,理解万岁

抱歉,削微略显激动。
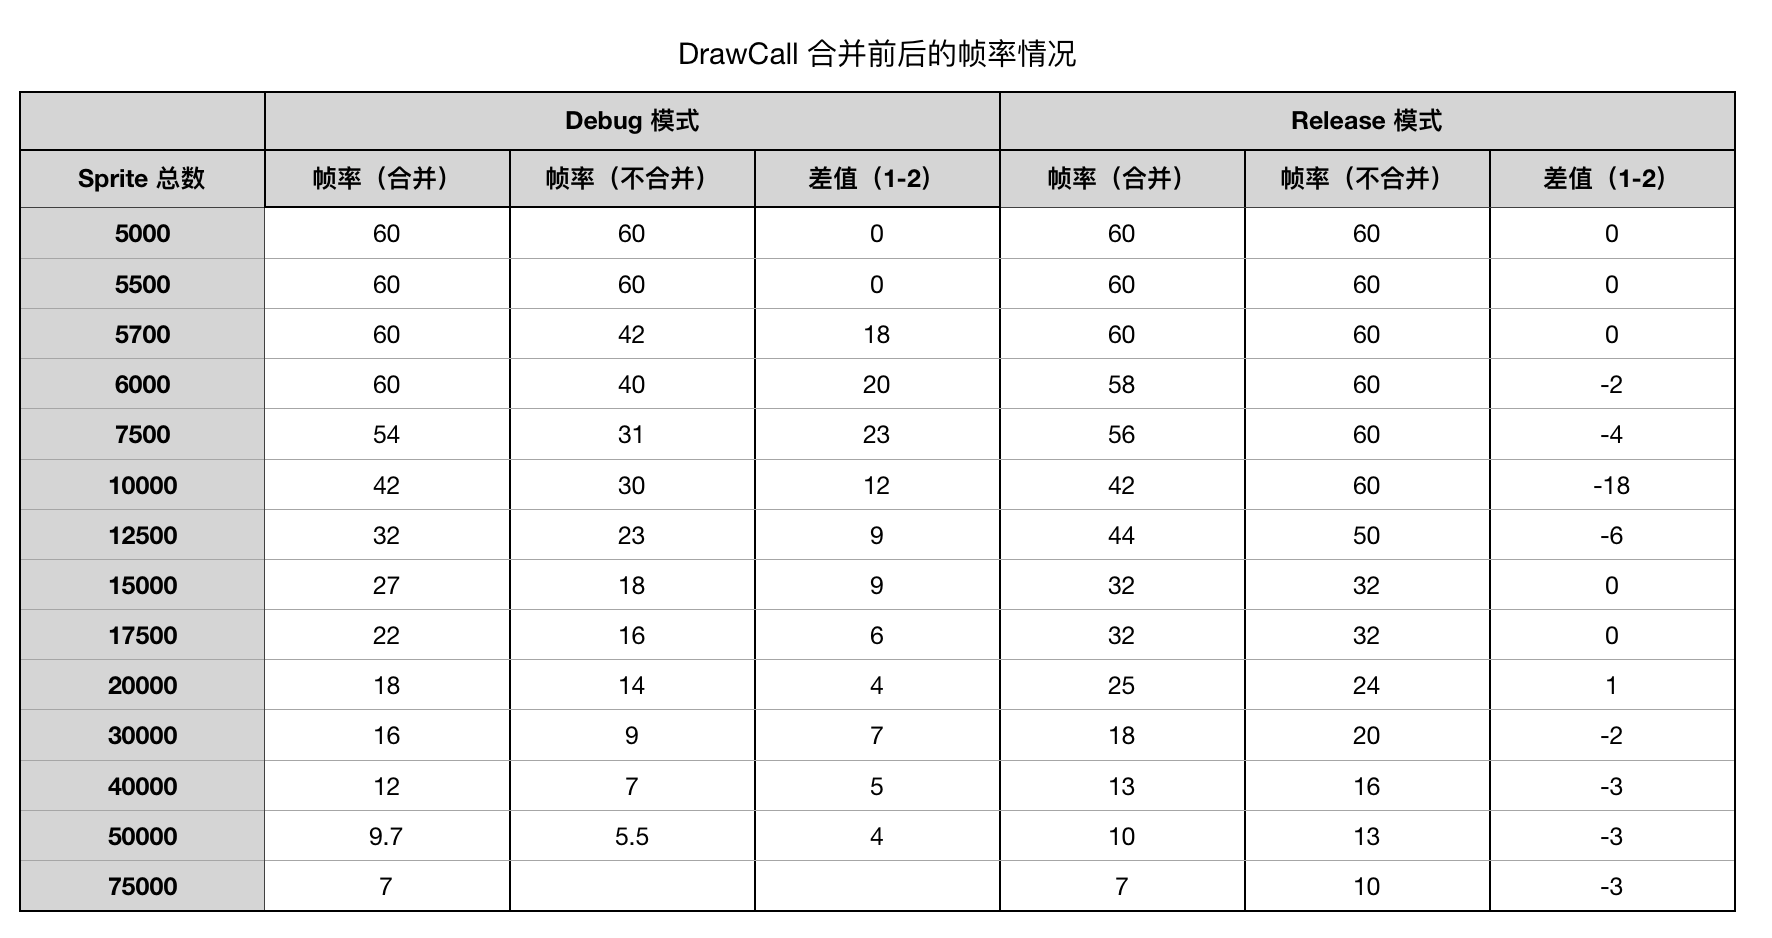
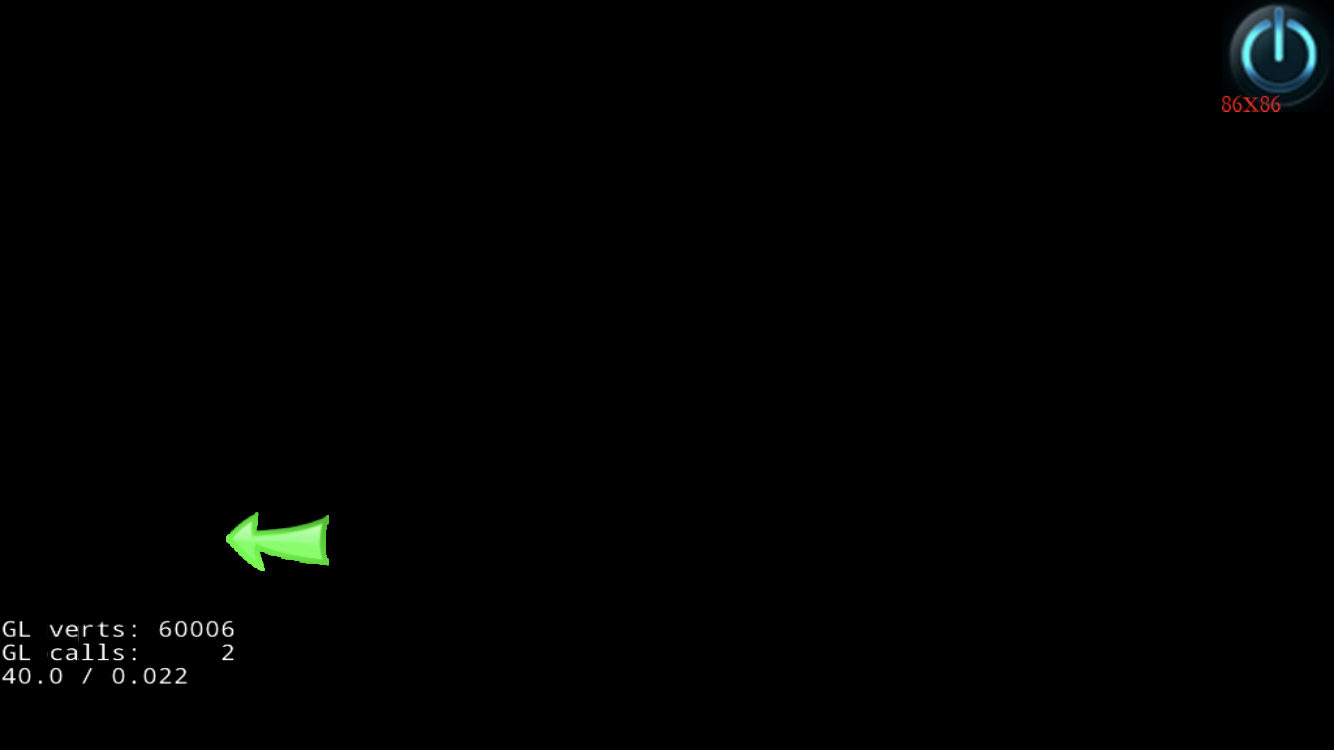
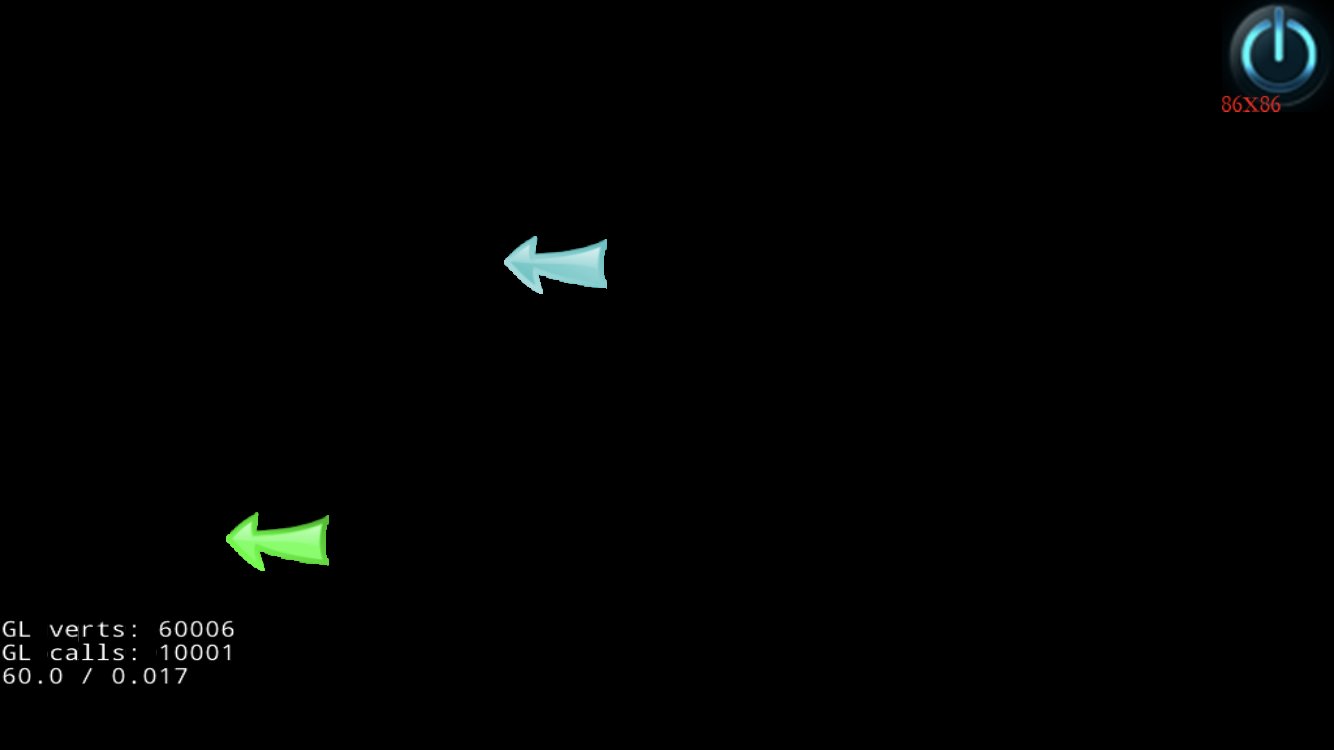
初步测试了一下,Debug 模式,合并 drawcall 有明显的帧率提升,Release 模式,两种情况帧率都有提升,但不合并 drawcall 的情况,帧率提升非常大,测试结果是这样的:
测试设备:iPhone8
测试代码:GitHub latest,修改 cpp-empty-test 测试
iOS 在 Release 模式下对 drawcall 做了很大的优化?
draw call 我觉着主要表现是在发热上面吧????
@tiffanyx 10000 个 Sprite 的话,CPU 占用了大部分的时间,性能的瓶颈已经到了 CPU 这端了。你可以在 Director::drawScene() 计算一下 CPU 的时间(直接把 render() 这行注释,这行里调用了 draw call)。我在 iPhone 6 测试时,10000 的 Sprite 的 CPU 耗时大概在 50 ms 左右,所以可以看出性能瓶颈在 CPU 这侧。
至于 @2627993092 说的 batch draw call 性能会更低的情况,我在 iPhone 6 没测出来,在我的 iPhone 6 是 batch draw call 会比没有 batch 时高个 2 帧左右,我会拿 iPhone 8 测试一下。如果是 batch 时的性能更低,我能想到的可能性是 batch 设置的 buffer 太大了,导致 GPU 的数据传输出现了瓶颈。
First of all, I'm assuming that with "draw calls", you mean the command that tells the GPU to render a certain set of vertices as triangles with a certain state (shaders, blend state and so on).

Draw calls aren't necessarily expensive. In older versions of Direct3D, many calls required a context switch, which was expensive, but this isn't true in newer versions.

The main reason to make fewer draw calls is that graphics hardware can transform and render triangles much faster than you can submit them. If you submit few triangles with each call, you will be completely bound by the CPU and the GPU will be mostly idle. The CPU won't be able to feed the GPU fast enough.

Making a single draw call with two triangles is cheap, but if you submit too little data with each call, you won't have enough CPU time to submit as much geometry to the GPU as you could have.

There are some real costs with making draw calls, it requires setting up a bunch of state (which set of vertices to use, what shader to use and so on), and state changes have a cost both on the hardware side (updating a bunch of registers) and on the driver side (validating and translating your calls that set state).

But the main cost of draw calls only apply if each call submits too little data, since this will cause you to be CPU-bound, and stop you from utilizing the hardware fully.

Just like Josh said, draw calls can also cause the command buffer to be flushed, but in my experience that usually happens when you call SwapBuffers, not when submitting geometry. Video drivers generally try to buffer as much as they can get away with (several frames sometimes!) to squeeze out as much parallelism from the GPU as possible.

You should read the nVidia presentation Batch Batch Batch!, it's fairly old but covers exactly this topic.
总结就是 合并draw call 可以让 GPU 负载更多算力,而不是CPU . (GPU空转的比较多,一般都在等待CPU提交数据命令)
因此, draw call 多的话, CPU 需要承担更多计算,容易发热.
上面测试的帧率变化不大,是因为即使不合并 draw call , 所增加的额外 CPU 计算也没有超过它的处理频率.
不知如何解释 CPU的处理频率.
既然没有超过处理频率,为何FPS不是满的呢.
或者说,如何才能营造一个测试环境,能够超过CPU的处理频率呢.
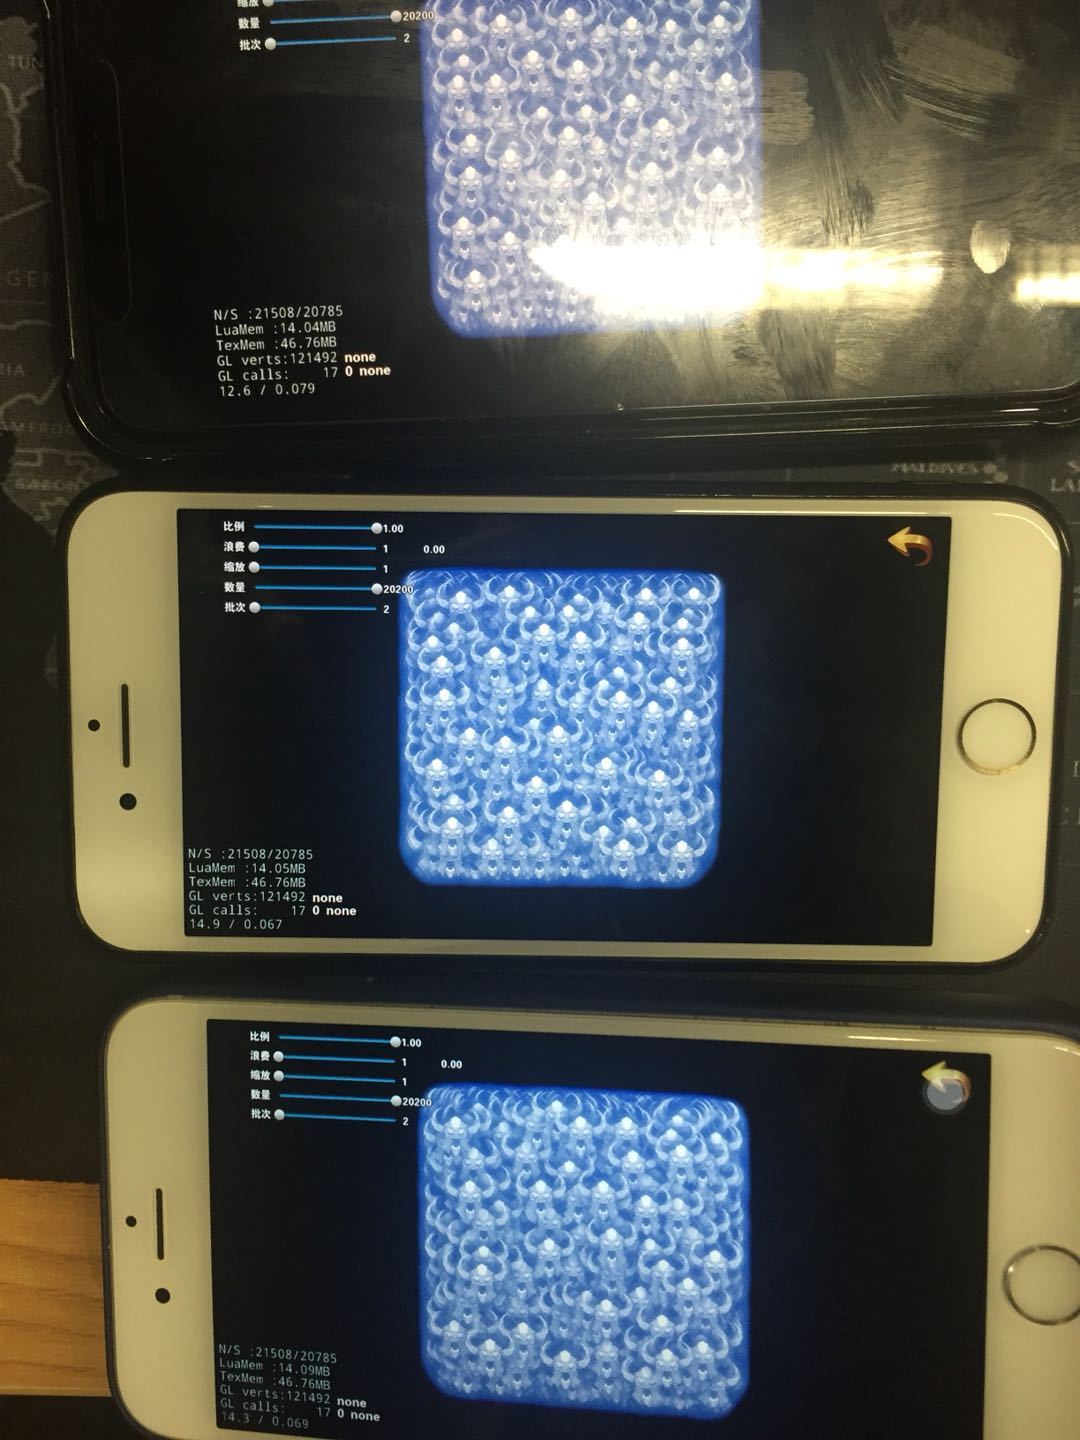
@minggo 我在iphone6s 上面的测试结果是合并与不合并 不相上下,多次测试结果, 有时候合并略高, 有时候不合并略高.
如果说GPU的数据传输出现了瓶颈, 那接下来我是否应该去测试同样10000 Sprite, 多少个drawCall FPS最高呢?
有微信群可以交流呢
iphone7的CPU是4核
由2颗高性能核心和2颗低性能核心组成.
根据我的观察
在手机未发烫的时候, 合并批次可以有效提升fps.高性能核心运转.
当测试经过2-5分钟后,fps会有一瞬间突然降低, 我认为这是高低性能核心在切换.
切换后,低性能核心运转,此时合并批次便没有明显提升fps的感觉了.
<= iphone6s的手机,应该只具备低性能核心. iphoneX和iphone7同理.
@2627993092 在iphone8上的测试结果,可能不太准确,我猜测是恰逢高低性能核心切换. 高性能测的nobatch,低性能测的batch.
我的测试环境是APP启动后, 在程序内切换的drawcall.
但如果是每次改代码重新启动APP,就不能确定当前运转的是高还是低性能核心了.
总结一下, 是不是只要确保手机不发烫, drawcall合并就会有效果. 否则会进入恶性循环.
发烫->降频->drawcall合并不起作用->更烫.
看来fps锁定30还是比较有必要的
求dalao指点.
以上都是我个人的推测和猜测.
你的推测确实很有道理。不过如果确实如你所猜测的话,那么我们得看文档是否有响应的机制可以锁住不让切换到小核。但是合并批次渲染不会是导致被切换的的原因吧,没有理由,所以我觉得不管是在大核还是小核,合并批次都不至于会降低性能。
至于合并批次是否会影响到 GPU 底层的驱动优化,我还没找到相关的资料说明。
在 iPhone 8 上的测试例也是应用内切换的,测试时我尽可能的关掉了后台,测试进行到后期时,手机发热比较严重(可能会影响到准确性),不过同一组数据,是在基本同样的发热条件下测试的。
这里面 Debug 模式,和 Release 模式差别这么大,这个信息也很重要。
我在一个低端android上进行测试.
华为 畅玩5 CUN-AL00 cpu 4核1.3
发现Cocos2dxRenderer.nativeRender()实际只用了35-40ms, 但是onDrawFrame()的调用间隔已经达到将近200ms.
Cocos2dxRenderer.nativeRender()的时间和左下角update和render的时间可以说是差不多吻合.
现在有点迷惑, 除了 nativeRender 这个方法,还有其他地方影响到onDrawFrame的再一次调用了吗?
glDrawElements方法是CPU把像素传输给GPU, 这里面包含实际渲染吗?
@minggo 求大佬解惑, 这消失的100多ms去哪了
另外, 合并drawcall对FPS的提升在android设备上,可以说是相当明显
我刚才用 iPhoneX 测试时发现,不合并 draw call 时帧率比较高,CPU 的的消耗也提升到 90% 以上(合并批次才 60%) 左右,从这里也可以侧面说明当不合并批次时被切换到了大核。
gl 的调用都没保证实际渲染,它是客户端、服务器模式,只有在 glSwapBuffer() 返回才确保这一帧的所有 gl 调用都被执行了。在 Android,glSwapBuffer 是系统调用的,是在 onDrawFrame 之后进行的。
最后解决方案呢?我也遇到这个问题,游戏序列帧比较多,内存只耗40M,cpu占90%,怎么办,开始进去不卡,玩一会儿手机烫了就奇卡无比。有没有解决方法。
我曹 挖坟了。。我也mark下